Trend 1: IPOs are frozen, but M&A is showing signs of bouncing back


Interpretation of the charts: The charts show that while IPO activity has slowed down significantly, M&A activity appears to be bouncing back and showing activity levels in line with 2019 levels.
Impact for small SaaS Companies: Most small software businesses weren’t on the IPO path. That said, it’s important to remember that there’s nuance in the capital markets. IPOs get a lot of attention, so the markets can feel worse when the narrative around IPOs is that there aren’t any. While this is true, it’s showing to be uncorrelated with M&A activity (the more likely exit option).
Trend 2: Multiples are lower because companies are growing slower, not because SaaS is “cheaper”


Interpretation of the charts: The first chart shows how multiples have changed over time, with a large jump around 2021 and the post-Covid multiples lower than pre-Covid. The latter two charts present a cause to that effect: there are no high-growth public SaaS companies anymore and the median growth rate has been steadily falling.
Impact for small SaaS Companies: Public SaaS data is the most available data. It’s easy to look at aggregate SaaS multiples and draw the conclusion that the sector is trading lower than before. This is true in the absolute sense, but a wrinkle in that narrative is that companies just aren’t growing nearly as much as before. All else equal, a company growing slower will trade for a lower multiple than a company growing faster. We aren’t necessarily in a slump, it’s just the SaaS companies got worse.
Trend 3: Before, we thought profitability would reign supreme. But growth is still most important.


Interpretation of the charts: The first slide is from November 2023. It shows that public SaaS companies were growing more slowly and becoming more profitable. It was expected these trends would continue and ultimately be rewarded in the markets. In fact, it’s playing out a bit differently. While companies are continuing to grow more slowly, the market is still rewarding growth (with some signs pointing to rewarding growth even more than before!). A highlight to interpret the 2nd graph: the regression shows that for a company growing 40%, the long-term average multiple was 14.3x and today it’s slightly higher at 14.4x. The impact is clear: growth is still incredibly important.
Impact for small SaaS Companies: This is a positive observation for most small SaaS companies. The main takeaway: your valuation is the result of the quality of your company. The market still rewards SaaS businesses that have high growth and strong retention, so if you have those things, you’ll still get plenty of buyer interest. To be clear: profitability still matters — if you aren’t breakeven or better, you might not have any buyers. But growth is still rewarded handsomely.
Trend 4: Not all subsectors are equal


Interpretation of the charts: The first chart measures the 1-year stock performance in 2023 and the second chart measures the multiple that the companies are trading at (from the end of 2023). Each chart is broken out by subsector.
Impact for small SaaS Companies: The key takeaway here is that while SaaS companies look similar in a lot of ways, their financial and operating profiles (and thus value) are impacted by their product and sector focus. Vertical software and security perform better on average than collaboration software, commerce, and front office business applications. As you think about selling your business, expect to receive a slight premium or discount depending on your subsector.
Trend 5: There’s lots of private equity capital, but it’s earmarked for larger companies
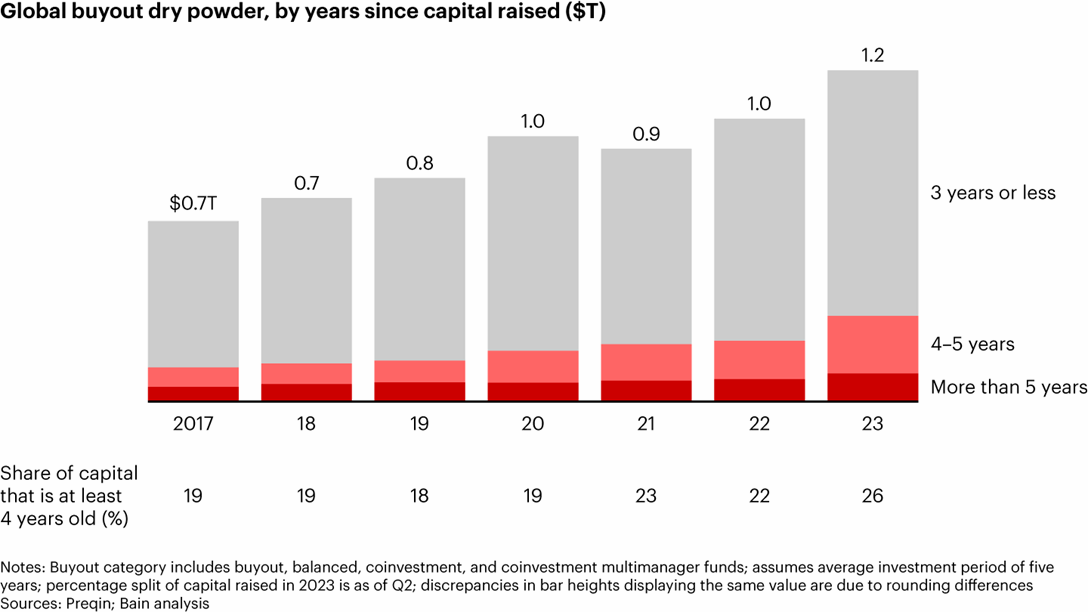

Interpretation of the charts: The first thing to callout is that these charts are tracking private equity activity across all sectors (not just software) and in the case of Bain, across several private asset classes (buyout, venture capital, real estate, etc.). That said, the insights are correct enough to be useful for software companies.
The first chart shows private equity dry powder (the amount of capital that they’ve raised but haven’t yet invested). Observation 1: it’s rising every year and is nearing 2x the total levels from 2017. Observation 2: the amount of dry powder that is 4-5 years old has increased at a very significant level. Both the amount of capital and the age of that capital have increased (in theory, increasing the likelihood of investing it).
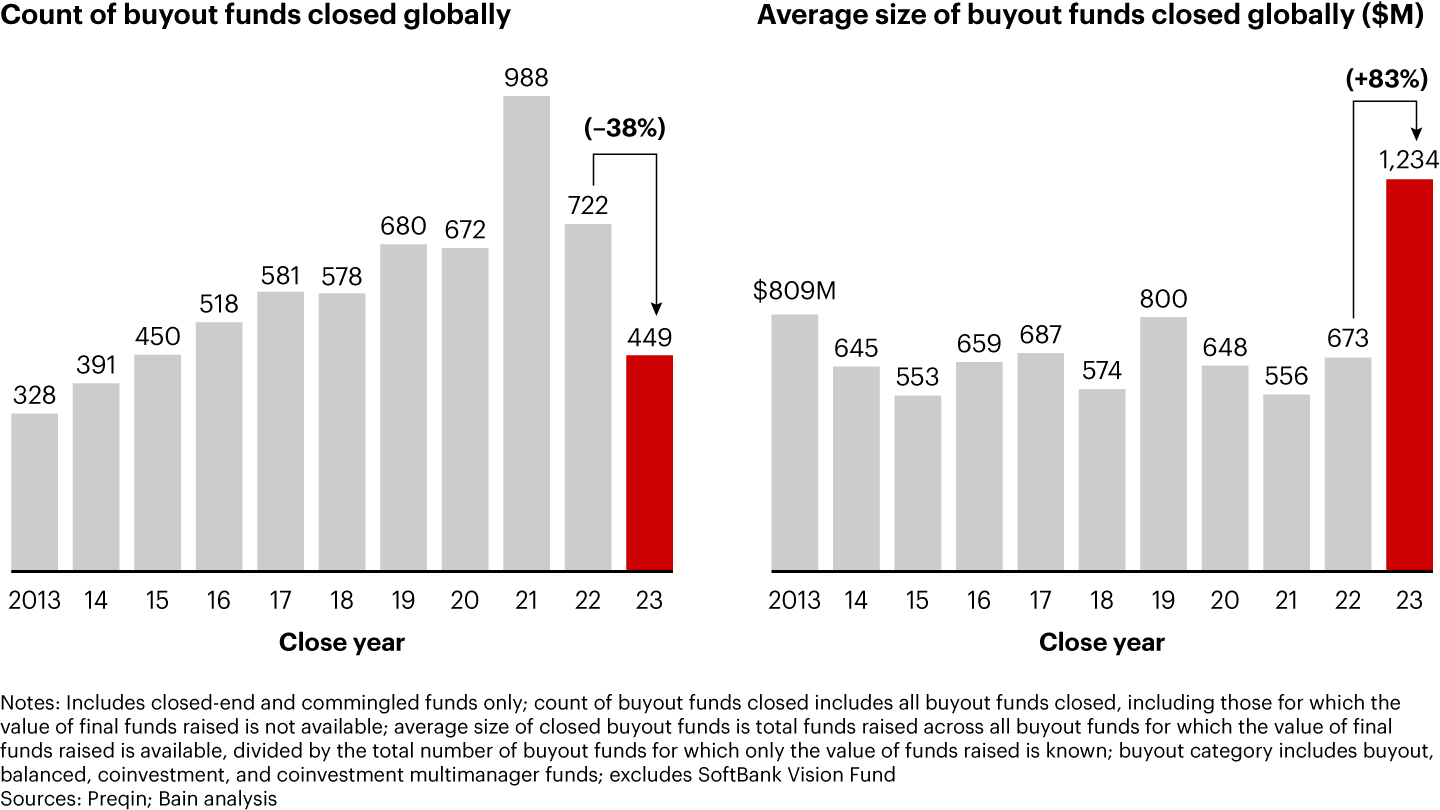
The second and third charts analyze a layer deeper, showing that large funds are raising more capital more easily than smaller funds. The Bain chart shows that the number of funds that have been raised has decreased, but it’s made up by the size of those funds (which is up 83% YoY). The last chart shows that at the upper end of the market, there is a lot of capital investing in a small amount of companies, where at the lower end of the market, there’s a small amount of capital investing in a large amount of companies. (Note: $10-250m revenue for a normal business might translate to a $5-40m ARR software business).
Impact for small SaaS Companies: First, you’ll earn a higher multiple for your business just by being a larger company. This has ~always been true and is further supported by more capital in the upper middle market. Second, the lower middle market has been insulated from lots of the swings of the broader market. The amount of dry powder targeting small is almost certainly also increasing, it’s just not as pronounced as larger funds (and certainly not talked about as much). If there’s any takeaway, it’s that perhaps you want to prioritize an equity rollover (or growth equity) so that you get some of the benefit on the second trade when the company is larger.